Payments Data
UK EITI annual payment data reconciliation

A core part of EITI requires oil, gas and mining companies to disclose voluntarily their payments to government agencies and for the reconciliation of these payments with government receipts from these companies. This ‘reconciliation process’ takes place on an annual basis and is conducted by an independent administrator (in the UK’s case, BDO LLP), overseen by the UK EITI Multi-Stakeholder Group (MSG).
The UK has now conducted this reconciliation exercise ten times, meaning that we have now placed on public record ten years’ worth of verified data on the financial flows between industry and government, covering 2014–2023. Our aim in publishing this data is to explain the contribution that the extractive sectors are making to the economic and social development of the country and to increase public understanding of the social and economic impacts of the sector and enrich public debate on the governance and stewardship of the UK's oil, gas and mineral resources.
The results of the reconciliation process on 2023 payments data, which took place in 2024, can be found below. The results from previous years can be found in our Publications & Reports page, using the ‘UK EITI Reports’ and 'Payments Data' filters.
Other sources of extractives payments data
Separate to the UK EITI payment reconciliation exercise and complementing the information in this report, a number of companies have reported their 2023 payments to governments around the world, including to UK government entities, under the Reports on Payments to Governments Regulations 2014 and the Disclosure Requirements and Transparency Rules and Prospectus Rules (before 21 July 2019) and the Prospectus Regulation Rules, which implement the EU Accounting and Transparency Directives.
Since 2014, large and publicly listed extractives companies in the UK have been required to disclose payments they make to governments on a country-by-country and project-by-project basis. This information is filed with the Companies House extractive service (UK-incorporated companies) and the Financial Conduct Authority’s National Storage Mechanism (London Stock Exchange Main Market-listed companies).
There can be differences in the amounts reported under UK EITI and under the UK Regulations. These differences can relate to interpretation of the scope of payment categories, reporting currency and timing.
The Natural Resource Governance Institute maintains a database of Payments to Governments reports submitted by companies under UK, EU/EEA and equivalent Canadian legislation. Resource Projects provides a platform to collect, display, download and search extractive project information using open data. It aims to harvest data on project-by-project payments to governments—based on mandatory disclosure legislation—and link it to associated information about the project from a variety of sources.
The databases are as follows:
- Government Entity Payments Resource Projects – an open-source data repository on oil, gas and mining projects.
- Project payments – Resource Projects – an open-source data repository on oil, gas and mining projects.
- United Kingdom of Great Britain and Northern Ireland - Resource Projects – an open- source repository on oil, gas and mining projects.
Introduction
The extractives sectors continue to make sizeable payments to the UK Government. In order to improve public understanding of these payments, UK EITI analyses these payments against each relevant tax and licence. The data is subject to a reconciliation exercise during which companies are requested to disclose their payments/repayments to HM Revenue & Customs (HMRC), The Crown Estate (TCE) or Crown Estate Scotland (CES) wherever these payments in a calendar year exceed a given threshold (£86,000). Government agencies are also asked to disclose their receipts from oil, gas, mining and quarrying groups. The independent administrator reconciles the declarations made by the companies with the data recorded by the government. The UK EITI website contains information on the oil and gas and mining and quarrying tax and licensing regimes.
This is the UK EITI’s tenth payments report. It provides detailed information on the reconciliation of payment streams between companies operating in the UK extractive sector and the relevant government agencies in 2023. The detailed data will be published on the UK EITI website.
The reconciliation process consisted of the following steps:
- analysis of the reconciliation scope prepared by the UK EITI Multi-Stakeholder Group (MSG).
- collection of payment data from government agencies and extractive companies which provide the basis for the reconciliation exercise.
- comparison of amounts reported by government agencies and extractive companies to determine if there were discrepancies between the two sources of information; and
- contact with government agencies and extractive companies to resolve any discrepancies.
Reconciliation Scope
For the year 2023, the following payment streams have been included:
- Oil and Gas (O&G) sector: combined total for Ring-Fence Corporation Tax (RFCT) and Supplementary Charge (SC), Petroleum Revenue Tax (PRT) and Advance Petroleum Revenue Tax (APRT), Energy (Oil and Gas) Profits Levy (EPL), payments to TCE and CES in respect of pipelines operated by companies that operate in UK extractive activities.
- Mining and Quarrying (M&Q) sector: Corporation Tax (CT), extractive-related payments to TCE and CES.
In line with the Reports on Payments to Government Regulations 2014, the materiality threshold applied to each revenue stream at group level remained unchanged at £86,000. The government agencies that were required to report for the 2023 UK EITI reconciliation exercise were HMRC, TCE and CES.
Based on historical results of the reconciliation exercises, the MSG agreed that, for payments from 2022 onwards, petroleum licence fees and the OGA Levy should be disclosed unilaterally by the North Sea Transition Authority (NSTA).
In addition, as in previous years, monetary payments to local planning authorities as part of planning obligations have been disclosed unilaterally by companies.
Extractive Industries Payments to/Repayments from UK Government
A total of 36 oil and gas companies and 13 mining and quarrying companies participated in the reconciliation exercise and formed the basis of the report compilation. This represents high industry participation covering 98.92% of potential in-scope payments as reported by government agencies. The MSG is grateful to all those companies that participated in the process this year. This report incorporates information collected up to 20 November 2024.
The table below summarises the reconciled extractive industries payments to and refunds from UK government agencies in 2023 and provides a breakdown of payments and refunds by sector and government agency. All material identified differences have been reconciled.
Please note that all payments data is available in CSV file format here when you select and filter Payments Data.
Table 1: Detailed Extractive Industries Payments to/Repayments from UK Government in 2023 [1]
This table provides an overview of the payments and refunds reported by extractive companies and government agencies in 2023, showing a net total £7.64 billion, made up of tax flows of over £7.99 billion offset by repayments of £0.35 billion. Most of these transactions cover RFCT/SC and EPL payments to HMRC. A net total of £70.53 million was reported by government agencies in respect of out-of-scope revenues, non- participating and out-of-scope companies and this is subtracted from the overall total, resulting in a net total of £7.57 billion reported by government and almost the same cumulative figure reported by in-scope companies. The final reconciliation shows a slight discrepancy of £215, which represents 0.000003% of the overall total of payments made in 2023
| (£million) | |||||
|---|---|---|---|---|---|
| Payment stream | Sector | Recipient | As per Government | As per companies | Difference(a) |
| (1) In-scope revenues (reconciled)(a) | |||||
| RFCT & SC | O&G | HMRC | 3,848.3 | 3,848.3 | |
| EPL | O&G | HMRC | 3.915.8 | 3.915.8 | - |
| PRT | O&G | HMRC | -349.5 | -349.5 | - |
| Payments to TCE | O&G | TCE | 1.9 | 1.9 | |
| Payments to CES | O&G | CES | 1.6 | 1.6 | - |
| CT | M&Q | HMRC | 119.1 | 119.1 | - |
| Payments to TCE | M&Q | TCE | 24.4 | 24.4 | - |
| Payments to CES | M&Q | CES | - | - | - |
| Sub-total (1) | 7,561.6 | 7,561.6 | -
| ||
| (2) Non-participating companies (unilateral disclosure) (b) | |||||
| EPL | O&G | HMRC | 5.6 |
|
|
| RFCT & SC | O&G | HMRC | -5.3 |
|
|
| CT | M&Q | HMRC | 2.9 | ||
| Payments to TCE | M&Q | TCE | 1.2 | ||
| Payments to CES | M&Q | CES | 0.3 | ||
| Sub-total (2) | 4.7 |
|
| ||
| (3) Out-of-scope companies (unilateral disclosure) (c) | |||||
| EPL | O&G | HMRC | 0.1 | ||
| Payments to TCE | O&G | TCE | 0.0 | ||
| Payments to CES | O&G | CES | 0.0 | ||
| CT | M&Q | HMRC | 0.1 | ||
| Sub-total (3) | 0.2 | ||||
| (4) Out-of-scope revenues (unilateral disclosure) | |||||
| PLF | O&G | NSTA | 46.9 | ||
| OGA Levy | O&G | NSTA | 30.4 | ||
| Section 106 (or similar) Payments | M&Q | Local Authorities | 0.2 | 0.2 | |
| Sub-total(4) | 77.5 | 0.2 | |||
| All revenues | |||||
| EPL | O&G | HMRC | 3,291.4 | ||
| RFCT & SC | O&G | HMRC | 3,842.9 | ||
| PRT | O&G | HMRC | -349.5 | ||
| PLF | O&G | NSTA | 46.9 | ||
| OGA Levy | O&G | NSTA | 30.4 | ||
| Payments to TCE | O&G | TCE | 2.0 | ||
| Payments to CES | O&G | CES | 1.7 | ||
| Total O&G | 7,495.8 | ||||
| CT | M&Q | HMRC | 122.0 | ||
| Payments to TCE | M&Q | TCE | 25.7 | ||
| Payments to CES | M&Q | CES | 0.3 | ||
| Section 106 (or similar) Payments | M&Q | Local Authorities | 0.2 | ||
| Total M&Q | 148.2 | ||||
| Total (1-4) | 7,644.0 | ||||
(a) All net unreconciled differences were below the materiality deviation agreed by the MSG.
(b) Comprises extractive companies with material payments that declined to participate in the reconciliation process.
(c) Comprises extractive companies out of the reconciliation scope because their payments / refunds were below the agreed materiality thresholds and non-material payment / refunds for companies that were in scope
Table 2: Extractive Industries Payments to/Refunds from UK Government in 2023
This table shows the breakdown of payments and refunds reported by government agencies detailed by sector and government agency.
(£million) | ||||||
|---|---|---|---|---|---|---|
| Sector / Recipient | HMRC | NSTA | TCE | CES | LAs | ALL |
| O&G | 7,414.8 | 77.3 | 2.0 | 1.7 | 0.0 | 7,495.8 |
| % | 98.9% | 1.0% | 0.0% | 0.0% | 0.0% | 100.0% |
| M&Q | 122.0 | 0.0 | 25.7 | 0.3 | 0.2 | 148.2 |
| % | 82.3% | 0.0 | 17.3% | 0.2% | 0.1% | 100.0% |
| Total | 7,536.9 | 77.3 | 27.7 | 2.1 | 0.2 | 7,644.0 |
| % | 98.6% | 1.0% | 0.4% | 0.0% | 0.0% | 100.0% |
Breakdown of Reconciled Data by Company and Sector
The two tables below set out the detailed results of the reconciliation exercise with post-reconciliation differences noted between amounts reported as paid by in-scope extractive companies and amounts reported as received by government agencies.[2]
Table 3: Oil & gas companies
This table lists the oil and gas companies that participated in the 2023 reconciliation process and provides a breakdown of their total payments and receipts that were above the agreed materiality thresholds.
| (in £000) | ||||||||
|---|---|---|---|---|---|---|---|---|
| Companies | As reported by Government Agencies | Total reported by company | ||||||
| PLF[3] | OGA Levy[3] | RFCT & SC | PRT | EPL | Payments to TCE | Payments to CES | ||
| A | B | C | D | E | F | G | ||
| Anasuria Hibiscus UK Ltd | 120 | 43 | 5,046 | 5,209 | ||||
| Apache Corporation | 1,251 | 843 | 200,109 | 142,431 | 344,634 | |||
| BP Plc | 4,283 | 1,620 | 907,000 | -90.596 | 621,000 | 269 | 1,443,575 | |
| CalEnergy Gas Ltd | -392 | -392 | ||||||
| Centrica Plc | 2,153 | 1,691 | 102,622 | -2,834 | 120,317 | 223,948 | ||
| Chevron | 93,539 | 61,019 | 154,558 | |||||
| CNOOC Petroleum Europe Ltd | 2,775 | 619 | 288,000 | 155,000 | 446,395 | |||
| CNR International UK Invest. Ltd | 149 | 571 | -4,608 | -39,380 | -43,268 | |||
| Dana Petroleum Ltd | 164 | 619 | 37,224 | -1,674 | 70,843 | 107,177 | ||
| ENI UK Ltd | 1,040 | 474 | 200,103 | -254 | 212,230 | 413,593 | ||
| EnQuest Plc | 1,307 | 690 | 282 | 17,683 | 113 | 20,074 | ||
| Equinor UK Ltd | 2,519 | 1,246 | 7,846 | 12,316 | 23,927 | |||
| Everard Energy Ltd[4] | 120 | 120 | ||||||
| ExxonMobil International Ltd | 2 | 19,465 | -58,794 | 77,000 | 37,673 | |||
| Harbour Energy Plc | 4,894 | 3,706 | 13,623 | -6,970 | 312,500 | 511 | 157 | 328,422 |
| Humbly Grove Energy Ltd | 12 | 1,178 | 1,190 | |||||
| INEOS Industries | 1,024 | 367 | -1,329 | 39,991 | 183 | 223 | 40,459 | |
| Iranian Oil Company (U.K.) Ltd | 104,491 | 78,835 | 183,326 | |||||
| Ithaca Energy UK | 3,322 | 1,079 | 72,010 | -172 | 73,500 | 149,739 | ||
| Neo Energy Production UK Ltd | 1,203 | 821 | -1,151 | 214,684 | 215,558 | |||
| Neptune Energy Group Ltd | 1,975 | 367 | -6,296 | -3,954 | ||||
| NSMP Operations Ltd | 207 | 207 | ||||||
| ONE-Dyas UK Ltd | 407 | 49 | 88,111 | 90,700 | 179,267 | |||
| Perenco UK Ltd | 2,033 | 1,938 | 216,020 | -7,760 | 144,623 | 561 | 357,415 | |
Prax Upstream Ltd[5] | 445 | 109 | 3,042 | 3,597 | ||||
| Repsol Resources UK Ltd | 1,588 | 2,519 | -39,011 | -41,500 | 6,231 | -70,173 | ||
| RockRose | 142 | 228 | 55,681 | 23,349 | 79,400 | |||
| SAGE North Sea Ltd | 259 | 259 | ||||||
| Serica Energy Plc | 555 | 733 | 181,047 | 98,730 | 281,065 | |||
| Shell plc | 3,036 | 3,690 | 29,987 | -61,960 | 369,000 | 651 | 142 | 344,547 |
| Suncor Energy UK Ltd[6] | 25 | 89,565 | 39,342 | 128,932 | ||||
| TAQA Bratani Ltd | 921 | 1,369 | 121,724 | -31,175 | 105,583 | 198,422 | ||
| TotalEnergies Holdings UK Ltd | 3,908 | 2,652 | 1,069,329 | 820,519 | 258 | 1,896,666 | ||
| Tullow Oil Plc | -9,520 | -2,329 | -11,849 | |||||
| Waldorf Production UK Ltd | 735 | 256 | -1,208 | -217 | ||||
Wintershall Noordzee B.V | 640 | 342 | 3,688 | 5,164 | 9,835 | |||
| Other payments[7] | 4,277 | -5,346 | 5,646 | 39 | 48 | 6,420 | ||
| Total | 46,881 | 30,442 | 3,842,910 | -349,477 | 3,921,399 | 1,946 | 1,675 | 7,495,756 |
Table 4: Mining & Quarrying companies
This table lists the mining and quarrying companies that participated in the 2023 reconciliation process and provides a breakdown of their total corporation tax payments and receipts and their total payments made to TCE that exceeded the materiality threshold. There were no payments by these companies to CES.
(in £000) | |||||
|---|---|---|---|---|---|
| Companies | As reported by Government Agencies
| ||||
Corporation | Payments | Payments | Section 106 | Total | |
| Aggregate Industries UK Ltd | 16,528 | 984 | 199 | 17,711 | |
| Albion Stone |
| 143 | 143 | ||
| Boskalis Westminster Holdings Ltd | 2,189 | 1,276 | 3,465 | ||
| Breedon Group PLC | 26,062 | 437 | 26,500 | ||
| Britannia Aggregates Ltd |
| 1,066 | 1,066 | ||
| Cemex UK Materials Ltd | 991 | 7,389 | 8,380 | ||
| DEME Building Materials Ltd |
| 1,787 | 1,787 | ||
15,000 | 3,398 | 18,938 | |||
| Irish Salt Mining & Exploration Co. Ltd | 1,496 |
| 1,496 | ||
| Saint-Gobain Ltd | 32,446 |
| 32,446 | ||
| Tarmac Holdings Limited | 22,012 | 4,140 | 26,152 | ||
| Van Oord UK Ltd | 2,173 | 496 | 2,669 | ||
| Volker Dredging Ltd | 183 | 2,854 | 3,037 | ||
| Other payments[7] | 2,955 | 1,200 | 338 | 199 | 4,494 |
| Total | 122,035 | 25,710 | 338 | 199 | 148,282 |
There were additional minor payments reported by the government agencies for companies that were in scope but whose payments were below the agreed materiality thresholds and for in-scope companies that did not participate in the reconciliation process. The totals of these payments are reported in Table 1 above and, for petroleum licence fees and the OGA levy, are included in the online disclosure of project level payments and repayments, which also includes reconciled field level data on petroleum revenue tax and project-level payments to TCE and CES.
Several companies have reported their 2023 payments to governments around the world, including to UK government entities, under the Reports on Payments to Governments Regulations 2014 as amended 2015 and the Accounts and Reports (Amendment) (EU Exit) Regulations 2019. This does not form part of the UK EITI payment reconciliation exercise but rather represents complementary information to this report. There can be differences in the amounts reported under UK EITI and under the EU Accounting and Transparency Directives. These differences can relate to interpretation of the scope of payment categories, reporting currencies and timing of payments. The Natural Resource Governance Institute maintains a database of Payments made to Governments and reports submitted by companies under UK, EU/EEA and equivalent Canadian legislation.[9]
Section 106 (Town and Country Planning Act 1990) Payments
Payments to local planning authorities in England and Wales are required under section 106 of the Town and Country Planning Act 1990 and equivalent legislation in Scotland and Northern Ireland. These payments are used to mitigate the impact of extractive activities on the local community and benefit local communities. These payments can provide external benefits, including the improvement of local road networks or community facilities.
Only one company reported material payments under section 106 or equivalent legislation, namely Aggregate Industries UK Ltd, which reported total payments of £199,309, detailed as follows:
Table 5: Section 106 (Town and Country Planning Act 1990) Payments
| Quarry | Local Authority (Beneficiary) | Payment (£) | Type of payment (Cash / in-kind) |
| 3349010040 | Flint County Council | 199,309 | Cash |
| Total | 199,309 |
Evolution of Extractive Revenues (2014 / 2023)
Extractive revenues rose by £763 million or 11% in 2023 compared to 2022 and significantly compared to the previous years from 2014 to 2020 (Figure 1 and table 6 below).
Figure 1: Net Payments to Government by Sector by Year (2014-2023)
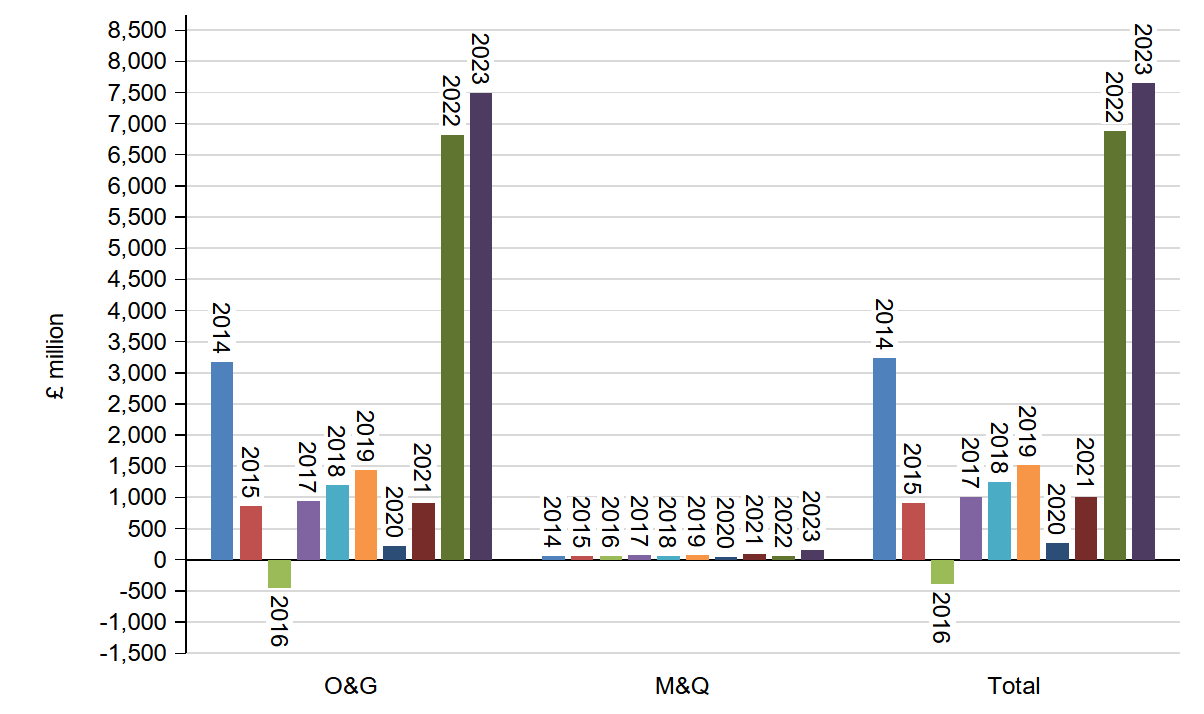
Table 6: Comparison between 2022 and 2023 extractive revenues (in £million)
| Payment stream | 2023 | 2022 | Variation | % | |
|---|---|---|---|---|---|
| O&G sector |
| ||||
| RFCT & SC |
| 3,842.9 | 5,364.8 | -1,521.9 | -28.4% |
| EPL |
| 3,921.4 | 1,770.5 | 2,150.9 | 121.5% |
| PRT |
| -349.5 | -393.9 | 44.4 | -11.3% |
| Sub-total HMRC | A | 7,414.8 | 6,741.3 | 673.5 | 10.0% |
| Licence fees |
| 46.9 | 50.9 | -4.0 | -7.9% |
| OGA Levy |
| 30.4 | 29.1 | 1.3 | 4.5% |
| Sub-total NSTA | B | 77.3 | 80.0 | -2.7 | -3.3% |
| Sub-total TCE | C | 2.0 | 2.4 | -0.4 | -17.5% |
| Sub-total CES | D | 1.7 | 1.6 | 0.1 | 6.2% |
| Total O&G | E = A-D | 7,495.8 | 6,825.3 | 670.5 | 9.8% |
| M&Q sector |
|
|
|
|
|
| Sub-total HMRC (CT) | F | 122.0 | 28.7 | 93.3 | 325.1% |
| Sub-total TCE | G | 25.7 | 26.3 | -0.6 | -2.3% |
| Sub-total CES | H | 0.3 | 0.3 | 0.0 | 0.0% |
| Section 106 (or similar) Payments | I | 0.2 | 0.1 | 0.1 | 77.2% |
| Total M&Q | J = F-I | 148.2 | 55.4 | 92.8 | 167.8% |
| Total | E + J | 7,644.0 | 6,880.7 | 763.3 | 11.1% |
The above table shows that the overall increase was mainly explained by EPL that increased by £2.2 billion or 121% because of the introduction of this tax in mid-2022.
However, RFCT/SC decreased by £1.5 billion or 28% because of the decrease in oil and gas prices.
Average oil prices received by UK producers were approximately £81/barrel (bbl) in 2022 and £65/bbl in 2023, representing a decrease of 20%. Crude oil prices fell as global markets adjusted to the new trade dynamics, Russian crude oil found destinations outside the EU and global crude oil demand was lower than expected. These dynamics offset the impact of OPEC+ crude supply restrictions.
The same applies for gas where the average prices received by UK producers were 194 p/therm in 2022 and 99 p/therm in 2023 representing a decrease of 49%.
Beneficial Ownership
As part of EITI reporting, companies are asked to disclose their beneficial owners; that is, information on the people who ultimately own and control each company.
Most UK-registered companies are required to submit information on people with significant control (PSC) to Companies House. Publicly listed companies are exempt from PSC requirements since they already provide beneficial ownership (BO) information under stock exchange requirements. Therefore, in order to disclose their BO information for EITI reporting, UK-registered companies need only to confirm their filings and provide the link to the relevant page at Companies House in their EITI BO declaration form. Private companies which have not filed information at Companies House on PSCs should disclose their BO information in the EITI BO declaration form.
All 49 companies which submitted EITI reporting templates also submitted a BO declaration form, duly signed by a senior officer. Twenty-seven of the reporting templates received were from companies that are either publicly listed or wholly owned subsidiaries of publicly listed companies, meaning that they provide BO information under stock exchange requirements (see Table 6 below). The remaining 21 companies are privately held (see Table 7 below).
Table 7: Publicly listed or wholly owned subsidiaries of publicly listed companies
| No | Sector | Company | Companies House Number | Parent company |
|---|---|---|---|---|
| 1 | M&Q | Aggregate Industries UK Ltd | 00245717 | Holcim Ltd |
| 2 | O&G | Anasuria Hibiscus UK Ltd | 09696268 | Hibiscus Petroleum Berhad |
| 3 | O&G | Apache Corporation | 07720972 | APA Corporation |
| 4 | M&Q | Boskalis Westminster Holdings Ltd | 00338917[10] 02380267[11] | Boskalis Westminster Holdings Ltd |
| 5 | O&G | BP Plc | 00102498 | BP PLC |
| 6 | M&Q | Breedon Group plc | Jersey 98465 | Breedon Group plc |
| 7 | M&Q | Cemex UK Materials Ltd | 00658390 | Cemex Espana, S.A. |
| 8 | O&G | Centrica plc | 03033654 | Centrica PLC |
| 9 | O&G | Chevron | 01006065 | Chevron Corporation |
| 10 | O&G | CNOOC Petroleum Europe Ltd | 01051137 | CNOOC LIMITED |
| 11 | O&G | CNR International UK Investments Ltd | 00813187 | Canadian Natural Resources Limited |
| 12 | M&Q | DEME Building Materials Ltd | 04590759 | CFE (DEME) |
| 13 | O&G | ENI UK Ltd | 00862823 | ENI SPA |
| 14 | O&G | EnQuest plc | 07140891 | EnQuest PLC |
| 15 | O&G | Equinor UK Ltd | 1285743 | Equinor ASA |
| 16 | O&G | ExxonMobil International Ltd | 05458042[12] 00207426 [13] | Exxon Mobil Corporation |
| 17 | M&Q | 6295350 | Heidelberg Materials UK Holding Ltd | |
| 18 | O&G | Harbour Energy plc | SC234781 | Harbour Energy plc |
| 19 | O&G | Ithaca Energy UK | SC272009 | Delek Group Ltd |
| 20 | O&G | Repsol Resources UK Ltd | 00825828 | Repsol SA |
| 21 | O&G | Shell Plc | 04366849 | Shell Plc |
| 22 | M&Q | Saint-Gobain Ltd | 03291592 | Compagnie de Saint-Gobain |
| 23 | O&G | Serica Energy (UK) Ltd | 04073712 | Serica Energy plc |
| 24 | O&G | Suncor Energy UK Ltd (NYSE) Suncor Energy UK Ltd (Toronto) | 00972618 | Suncor Energy UK Holdings Ltd |
| 25 | O&G | TAQA | 05975475 | Abu Dhabi Developmental Holding Company PJSC (ADQ) |
| 26 | M&Q | Tarmac Holdings Ltd | 07533961 | CRH plc |
| 27 | O&G | TotalEnergies Holdings UK Ltd | 01722136 | TOTALENERGIES SE |
| 28 | O&G | Tullow Oil Plc | 3919249 | Tullow Oil Plc |
Table 8: Privately held companies
| No | Sector | Company | Companies House Number | Parent company |
|---|---|---|---|---|
| 1 | M&Q | Albion Stone | 01767530 | Albion Stone |
| 2 | M&Q | Britannia Aggregates Ltd | 02304376 | Britannia Aggregates Ltd |
| 3 | O&G | CalEnergy Gas Ltd | 04370508 | Northern Powergrid Holding Company |
| 4 | O&G | Dana Petroleum Ltd | 03456891 | Dana Petroleum Ltd |
| 5 | O&G | Everard Energy Ltd | 08066733 | Everard Energy Ltd |
| 6 | O&G | Humbly Grove Energy Ltd | 04689011 | EPUK Investments Ltd |
| 7 | O&G | SC200459 10660338 09121775 | INEOS Industries | |
| 8 | O&G | Iranian Oil Company (U.K.) Ltd | 01019769 | Iranian Oil Company (U.K.) Ltd |
| 9 | M&Q | Irish Salt Mining & Exploration Co. Ltd | NI006389 | Irish Salt Mining & Exploration Co. Ltd |
| 10 | O&G | NEO ENERGY Production UK Ltd | 12086835 | HV INVET ETA Ltd |
| 11 | O&G | Neptune Energy Group Ltd[14] | 10647707 | Neptune Energy Group Ltd |
| 12 | O&G | NSMP Operations Ltd | 09711370 | Selkie Investments Midstream Midco 2 Ltd |
| 13 | O&G | ONE-Dyas UK Ltd | 03531783 | ONE-Dyas UK Ltd |
| 14 | O&G | Perenco UK Ltd | 04653066 | Perenco UK Ltd |
| 15 | O&G | Prax Upstream Ltd | 13920571 | Prax Group Holdings Ltd |
| 16 | O&G | RockRose Energy Ltd | 09665181 | Viaro Investment Limited |
| 17 | O&G | SAGE North Sea Ltd | FC033971 | Ancala Midstream Acquisitions Limited |
| 18 | M&Q | Van Oord UK Ltd | 01805156 | Van Oord UK Ltd |
| 19 | M&Q | Volker Dredging Ltd | 01179300 | Volker Dredging Ltd |
| 20 | O&G | Waldorf Production UK Ltd | 11957078 | Waldorf Energy Partners Ltd |
| 21 | O&G | Wintershall Noordzee B V | BR009394 | Wintershall Noordzee B V |
Information on the beneficial owners of these 21 privately held companies can be found on the Companies House website[15] by searching for the company of interest and using the 'people' tab to access information about PSCs. For ease of reference, all this information is available by following the links in the third column of the above table.
Private companies are also asked to disclose information on all owners who are identified as politically exposed people (PEP), i.e. those who have political influence or who, as family members or close associates, have links to senior political figures or government officials in the UK or abroad and who have a shareholding regardless of their ownership level (the 2022 threshold was 5%) in the company. In 2023, no privately owned companies making material payments under the EITI Standard disclosed any PEPs. We cannot comment on whether companies which did not participate in this year’s reporting process are owned by any PEP.
Several extractive companies making material payments to the UK government are ultimately controlled by foreign government entities. It is considered important that the UK’s BO system can accurately capture details of foreign government ownership of companies operating in the UK’s extractive sector.
More information on the UK’s BO regime can be found on the beneficial ownership page of the UK EITI website.
The MSG agreed that it would be appropriate to use a separate template and request BO information from the non-material and the NSTA licensee companies. The template was uploaded on the UK EITI website.
All licensees were requested to download the BO declaration form and return the completed version to the IA by 26 April 2024 at ukeiti@bdo-ifi.com.
However, no additional responses from companies not involved in the reconciliation exercise had been received as of the date of this report.
The UK 2023 EITI Payments Report was the first to follow the 2023 EITI Standard launched in Dakar in June 2023. This includes several new and refined provisions that enable countries to respond to the most pressing challenges in governing natural resource extraction.
The new Standard strengthens EITI disclosures and governance requirements to improve understanding of the impact of the energy transition, addresses corruption risks, promotes gender equity and strengthens revenue collection.
The data requested from UK companies included anti-corruption policies, ownership structure, financial statements, environmental, social and governance (ESG) data and gender pay data. A summary of the information received from companies is available here.
Please note that under the UK EITI Open Data policy users can re-use the data in the tables and figures.
Annex B: Glossary of Abbreviations
| APRT | Advance Petroleum Revenue Tax |
| CES | Crown Estate Scotland |
| CT | Corporation Tax |
| EEA | European Economic Area |
| EITI | Extractive Industries Transparency Initiative |
| EU | European Union |
| HM | His Majesty’s |
| HMRC | His Majesty’s Revenue & Customs |
| LAs | Local Authorities |
| M&Q | Mining & Quarrying |
| MSG | UK EITI Multi-Stakeholder Group |
| NSTA | North Sea Transition Authority |
| NYSE | New York Stock Exchange |
| O&G | Oil & Gas |
| OGA | Oil and Gas Authority |
| PEP | Petroleum Exposed People |
| PRT | Petroleum Revenue Tax |
| PSC | People with Significant Control |
| RFCT | Ring Fence Corporation Tax |
| SC | Supplementary Charge |
| TCE | The Crown Estate |
| UK | United Kingdom |
- Payments for petroleum licence fees, the OGA Levy, field-level petroleum revenue tax payments and payments to TCE and CES are included in the online disclosure of project level payments and repayments at https://www.ukeiti.org/publications-reports.
- The figures in Tables 2 and 3 below are rounded to the nearest thousand pounds. The full details in pounds are included in the CSV/Excel files, which can be found at the following link: https://www.ukeiti.org/publications-reports.
- Petroleum licence fees and the OGA Levy were disclosed unilaterally by the NSTA
- Formerly HH Laps Ltd.
- Formerly Hurricane Energy Plc.
- Suncor Energy UK Ltd was acquired by Equinor UK Limited in June 2023.
- Includes 1) extractive companies out of the reconciliation scope because their payments/refunds were below the agreed materiality thresholds, 2) those with material payments that declined to participate in the reconciliation process and 3) non-material payments/refunds for companies that were in-scope.
- Rebranded from Hanson UK to Heidelberg Materials UK in 2023.
- www.resourceprojects.org.
UK-incorporated companies, where a parent company is not reporting in a non-UK jurisdiction, file payments reports online with the Companies House Extractives Service: https://extractives.companieshouse.gov.uk
London Stock Exchange Main Market-listed companies (including those that are both UK and non-UK incorporated) file payment reports online with the Financial Conduct Authority’s National Storage Mechanism: https://data.fca.org.uk/#/nsm/nationalstoragemechanism - Llanelli Sand Dredging Ltd.
- Westminster Gravels Ltd.
- XTO UK Ltd.
- Esso Exploration and Production UK Ltd
- Neptune Energy Group Limited was acquired by ENI in June 2023.
- https://www.gov.uk/government/organisations/companies-house