Sector Data
The extractive industries in the UK comprise oil and gas production, mining and quarrying. These sector continues to play a major role in the UK economy, contributing an estimated total £28 billion Gross Value Added in 2024 and directly providing between 50,000 and 60,000 jobs in the private sector, with many more supported in the industries' wider supply chains.

Value of the sector
The extractive industries comprise mining and quarrying, including oil and gas production.
The sector has made a sizeable contribution to the UK economy for many years and remains an important sector, both directly and by supporting substantial added value in downstream industries and related supply chains. By far the largest economic contribution comes from oil and gas production.
In 2024, total UK extractive industry gross value added (GVA) was £28 billion, down from £32 billion in 2023, with oil and gas production and associated support service activities accounting for over 95% of the sector’s GVA [1].
Construction minerals, principally crushed rock and sand and gravel aggregates, represent the largest materials flow in the UK. The market for these minerals depends upon the level of UK construction activity and longer-term construction-related demand.
Although payments made by coal mining companies are no longer considered material relative to overall government revenues and to UK EITI reporting the continuing economic contribution of the coal sector is still included in the background information set out below.
In some of the summary information below, coal is grouped with oil and gas (for example where data are available for fossil fuels but not for other parts of the sector). However, for most of this section, oil and gas are treated separately from mining and quarrying, including coal. In addition, it should be noted that the phrase “mining and quarrying” as used in UK national statistics embraces the whole UK extractive sector including oil and gas production as well as coal production. Mining support services are also included in this sector. Some of the data reported below include those activities while other data exclude them.
Figure 1. Extractive Industry Gross Value Added
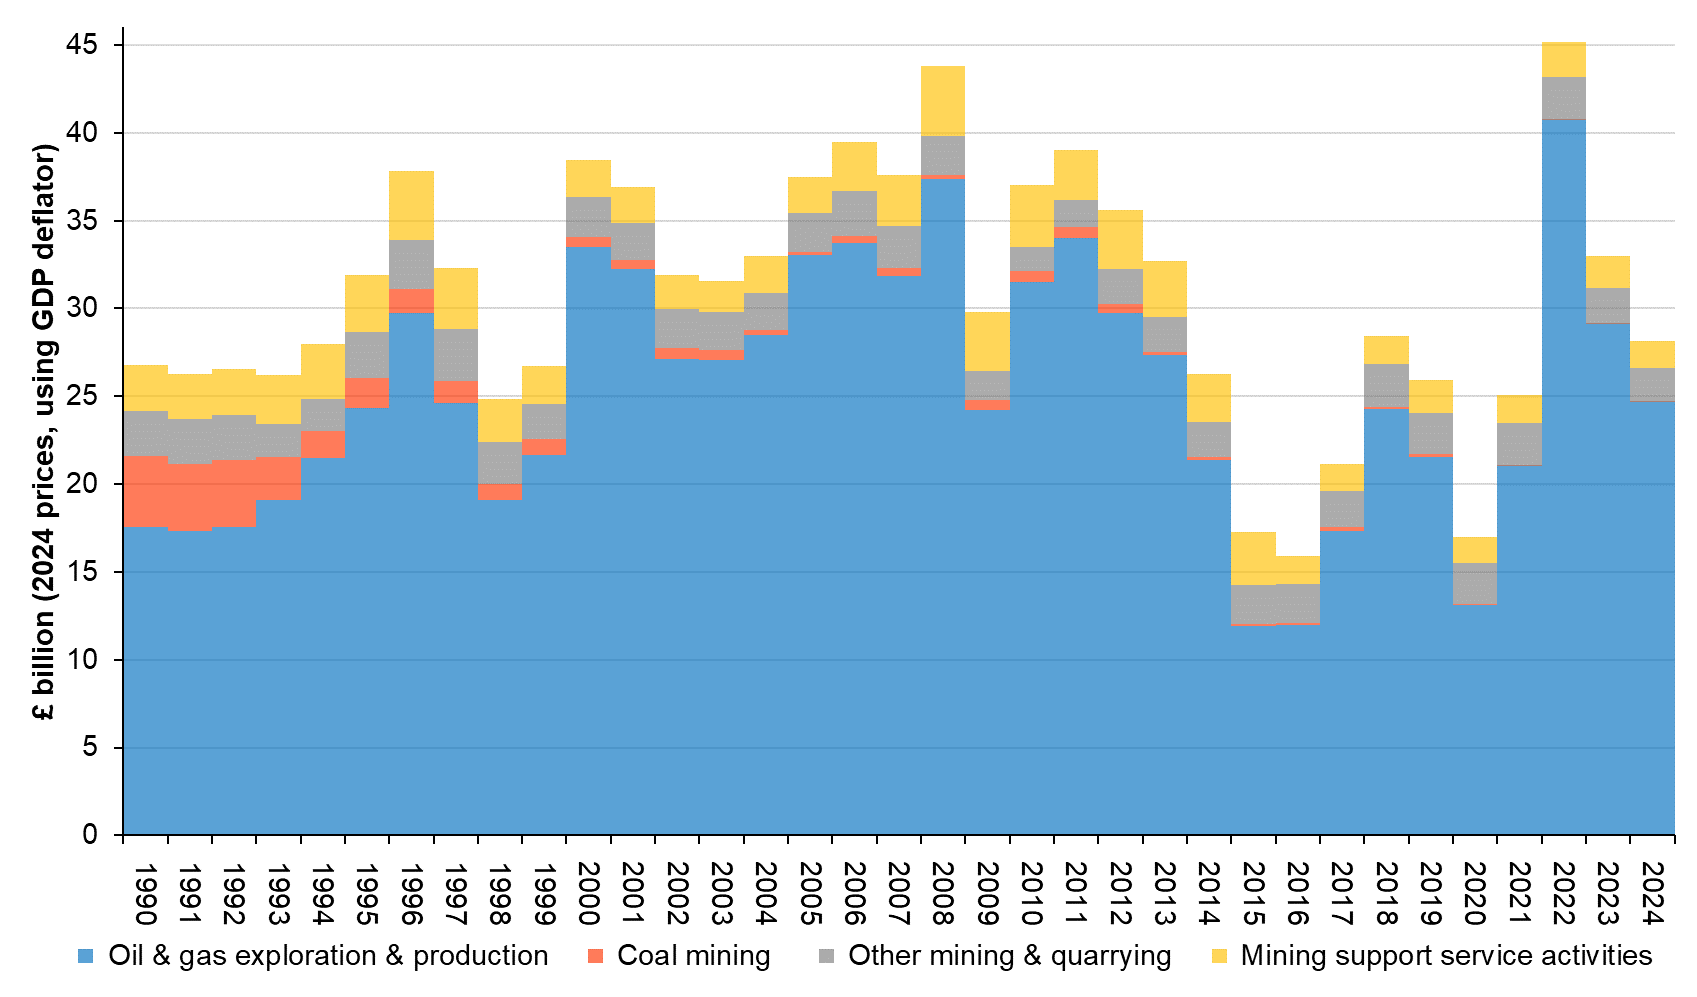
Source: ONS, UK GDP(O) low level aggregates, 28 March 2025
The data presented in Figure 1 above are available on request from the UK EITI Secretariat.
Table 1 shows GVA for the main components of the mining and quarrying sector as reported in UK national statistics.
As noted above, this sector includes fossil fuel production, other mining and quarrying and mining support service activities, but excludes the value of products manufactured with extracted minerals. The table gives for each subsector its percentage share of total UK GVA for the most recent year. It also shows the whole sector’s GVA as a percentage of national gross domestic product (GDP) for each year [2].
| Year | Extraction of crude petroleum and natural gas | Mining of coal | Other mining and quarrying | Mining support service activities | Total mining and quarrying including oil and gas | Total UK GVA | Total UK GDP | Extractives share of total GDP |
|---|---|---|---|---|---|---|---|---|
| (A) | (B) | (C) | (D) | (E) = sum of (A)–(D) | (F) | (G) | (E) / (G) | |
| 2018 | 19,317 | 77 | 1,930 | 1,290 | 22,614 | 1,920,289 | 2,152,304 | 1.05% |
| 2019 | 17,515 | 123 | 1,911 | 1,491 | 21,040 | 1,995,708 | 2,233,921 | 0.94% |
| 2020 | 11,332 | 62 | 1,944 | 1,191 | 14,529 | 1,897,957 | 2,104,288 | 0.69% |
| 2021 | 11,212 | -21 | 2,007 | 1,386 | 14,584 | 2,046,636 | 2,284,079 | 0.64% |
| 2022 | 14,762 | 25 | 2,184 | 1,792 | 18,763 | 2,194,113 | 2,505,981 | 0.75% |
2023 | 10,571 | 31 | 1,998 | 1,643 | 14,242 | 2,310,938 | 2,687,186 | 0.53% |
| %* | 0.46% | 0.00% | 0.09% | 0.07% | 0.62% | 100% |
* The percentages in this row are shares of total UK GVA for all industries in 2023.
Source: ONS, UK GDP(O) low level aggregates, published 28 March 2024.
The data presented in Table 1 above are available on request from the UK EITI Secretariat.
The next two tables give additional data on the sector including finer disaggregation where available using data from the ONS and DESNZ, respectively. The sources for these estimates vary so they are not always aligned but they are indicative of the relative scale of the various parts of the sector.
| SIC 07 Code | Description | Number of enterprises | Approximate gross value added at basic prices (aGVA) | Total employment costs |
|---|---|---|---|---|
| Number | £ million | £ million | ||
| 06 | Extraction of crude petroleum and natural gas | 139 | 29,299 | 1,996 |
| 09.1 | Support activities for petroleum and natural gas extraction | 172 | 3,164 | 1,633 |
| 08.11 | Quarrying of ornamental and building stone, limestone, gypsum, chalk and slate | 218 | 1,406 | 577 |
| 08.12 | Operation of gravel and sand pits; mining of clays and kaolin | 151 | 1,076 | 376 |
| 08.9 | Mining and quarrying not elsewhere classified | 423 | 158 | 171 |
| of which: | ||||
| 08.92 | Extraction of peat | 14 | 64 | 19 |
| 08.93 | Extraction of salt | 10 | 112 | 36 |
| 09.9 | Support activities for other mining and quarrying | 210 | 71 | 68 |
| B | Mining and quarrying including mining of coal and metal ores | 1,333 | 35,268 | 4,865 |
Source: Annual Business Survey (ONS, 8 April 2024)
The data presented in Table 2 above are available on request from the UK EITI Secretariat.
Table 3. Number of businesses and employers in the private sector and their associated employment, UK, 2023

Sources: Business population estimates for the UK and the regions 2023 (DESNZ, 5 October 2023), Tables 6 & 7, and (number of enterprises) Nomis (accessed 15 October 2023).
The data presented in Table 3 above are available on request from the UK EITI Secretariat.
Government revenues
UK government accounts cover a financial year running from April to March rather than a calendar year, so most of the data on government revenues are of necessity on a financial year basis.
Where possible, calendar year data have (also) been provided. Oil and gas companies have a distinct tax regime, allowing identification of their extractive-related tax payments (and repayments), whereas mining and quarrying companies pay mainstream corporation tax. This means the data for extractive-related tax receipts from mining and quarrying companies cannot be separated out. Details on tax revenues can therefore be found in the separate upstream oil and gas in the UK section.
Section 106 payments are made (in England, plus equivalent payments made elsewhere in the UK) to local authorities relating to the granting of planning permission for mining operations to cover, for example, local road and infrastructure improvements. These are the only mandated social expenditure by extractive companies.
There are no non-monetary arrangements between extractive companies and the government in the UK.
Forecasts of UK government oil and gas revenues are published by the independent Office for Budget Responsibility (OBR). The OBR also publishes details of its underlying forecasts of oil and gas production, prices and expenditure broken down between exploration and appraisal, development capital expenditure, operating costs and decommissioning costs.
Table 4 includes environmental taxes paid by the UK extractive industries. These are not extractive-related so are not included in the reconciliation of payments and receipts.
| £ million | 2017 | 2018 | 2019 | 2020 | 2021 | 2022 | 2023 |
|---|---|---|---|---|---|---|---|
| Government revenue from energy taxes (incl. EU ETS) | 174 | 218 | 330 | 283 | 294 | nya | nya |
| Government revenue from transport taxes | 44 | 36 | 33 | 23 | 15 | nya | nya |
| Government revenue from pollution and resource taxes | 378 | 370 | 400 | 364 | 414 | nya | nya |
| of which Aggregates Levy | 375 | 366 | 396 | 360 | 411 | 375 | 345 |
| Total Government revenue from environmental taxes | 595 | 623 | 762 | 669 | 723 | nya | nya |
nya = not yet available
Source: Environmental taxes in the United Kingdom (ONS, 7 May 2024)
The data presented in Table 4 above are available on request from the UK EITI Secretariat.
The EU ETS is the EU Emissions Trading System; the UK Emissions Trading Scheme (UK ETS) which replaced the UK’s participation in the EU ETS in 1 January 2021. Like the EU ETS, the UK ETS is a cap-and-trade system which caps the total level of greenhouse gas emissions, creating a carbon market with a carbon price signal to incentivise decarbonisation.
Participants in the UK ETS are required to obtain and surrender allowances to cover their annual greenhouse gas emissions. Participants can purchase allowances at auction or trade them amongst themselves, which allows the market to find the most cost-effective way to reduce emissions. Industrial sectors considered at risk of carbon leakage (whereby carbon costs would make them uncompetitive prompting industry to relocate outside the country in which the ETS applies) receive a proportion of allowances for free.
The Government has established the scheme to increase the climate ambition of the UK’s carbon pricing policy and provides continuity of emissions trading for UK businesses. Many of the features and processes in the new UK scheme will be familiar to operators. The UK ETS was established through The Greenhouse Gas Emissions Trading Scheme Order 2020.
The UK Government, Scottish Government, Welsh Government and Department of Agriculture, Environment and Rural Affairs for Northern Ireland collectively constitute the UK ETS Authority to oversee the scheme.
Emissions trading schemes work on the ‘cap and trade’ principle, where a cap is set on the total amount of certain greenhouse gases that can be emitted by sectors covered by the scheme. This limits the total amount of carbon that can be emitted and, as it decreases over time, will make a significant contribution to how we meet our Net Zero 2050 target and other legally binding carbon reduction commitments.
The Aggregates Levy was introduced in 2002 and is a tax on sand, gravel or rock that has been dug from the ground, dredged from the sea or imported into the UK. It is intended to tax only materials that are extracted for use as bulk fill in construction. It is generally payable by the quarrying industry but can also apply when aggregate is removed in the course of infrastructure projects. More information is given in the Environmental Taxes Bulletin.
Exports
The UK both imports and exports all types of mining and quarrying production but is generally a net importer of each type. Information on trade flows is given in the relevant sectoral sections.
The ONS produce UK Trade Statistical Bulletins each month, as well as quarterly UK Trade in Goods by Classification of Product by Activity. Gross extractives exports in 2023 as reported by ONS in February 2024 amounted to 2.7% of total UK gross exports by value.
Employment
Table 5 gives estimates of the total UK workforce jobs directly supported by the UK mining and quarrying sector including its major sub-sectors. The extractive industries are typically capital- rather than labour-intensive and correspondingly represent a significantly smaller share of workforce jobs than of GVA. All extractive employment shown in this and subsequent tables is in the private sector.
| Year | Production of oil and gas | Mining of coal | Mining of metal ores and other mining and quarrying | Mining support service activities* | Total extractive industries | All UK Industries |
|---|---|---|---|---|---|---|
| 2018 | 14.1 | 0.6 | 20.8 | 27.3 | 62.8 | 34,882 |
| 2019 | 14.2 | 0.8 | 22.3 | 24.5 | 61.8 | 35,383 |
| 2020 | 14.9 | 0.6 | 21.3 | 23.0 | 59.8 | 34,807 |
| 2021 | 13.0 | 0.5 | 20.0 | 19.8 | 53.3 | 35,010 |
| 2022 | 11.4 | 0.4 | 21.0 | 19.8 | 52.5 | 35,794 |
| 2023 | 11.6 | 0.4 | 22.3 | 21.3 | 55.5 | 36,554 |
| 2023 | 0.03% | 0.00% | 0.06% | 0.06% | 0.15% | 100% |
* Almost all of this is in support of oil and gas production
Source: ONS (March 2024), DESNZ (July 2023)
The data presented in Table 5 above are available on request from the UK EITI Secretariat.
Table 6 shows estimates of extractive industry employment in Great Britain (the UK excluding Northern Ireland) at a finer level of disaggregation than is available for the workforce jobs estimates for the UK.
Table 6. Extractive industry employment in Great Britain and United Kingdom (in thousands)

Source: ONS, Business Register and Employment Survey (Table 2a) (GB data: UK data as Table 5)
The data presented in Table 6 above are available on request from the UK EITI Secretariat.
Table 7 shows the proportion of females in the workforce in recent years in the extractive sector and the economy as a whole. Shares in 1996, the first year for which comparable data exist, are also shown. The longer-term trend in female representation in the extractive sector is clear.
| Coal, oil and gas production | Mining of metal ores and other mining and quarrying | Mining support service activities | Total extractive industries | All UK Industries | |
| 1996 | 8% | 4% | 10% | 7% | 48% |
| 2018 | 24% | 16% | 14% | 17% | 48% |
| 2019 | 20% | 18% | 13% | 17% | 48% |
| 2020 | 19% | 14% | 17% | 17% | 48% |
| 2021 | 20% | 20% | 15% | 18% | 49% |
| 2022 | 19% | 15% | 18% | 17% | 49% |
2023 | 21% | 13% | 18% | 17% | 49% |
Source: ONS(March 2024)
The data presented in Table 7 above are available on request from the UK EITI Secretariat.
Gender pay gap data is available here and can be downloaded by specific company or sector.
Table 8 Total UK Employment by Nationality, Gender and Age in Mining & Quarrying including Oil and Gas 2014-2024
| Mining and Quarrying including Oil and Gas | ||||||||||||||||
|---|---|---|---|---|---|---|---|---|---|---|---|---|---|---|---|---|
| Total employment | Total employment | % | Of which UK nationals | % | 18 to 64 year olds | |||||||||||
| Total | UK nationals | % | Male | % | UK nationals | % | Female | % | UK nationals | % | ||||||
| 2015 | 28,970,525 | 56,875 | 0.20% | 52,558 | 92% | 55,600 | 51,233 | 92% | 46,100 | 83% | 42,900 | 93% | 9,500 | 17% | 8,333 | 88% |
| 2016 | 29,438,733 | 50,867 | 0.17% | 47,183 | 93% | 49,683 | 46,017 | 93% | 41,250 | 83% | 38,517 | 93% | 8,433 | 17% | 7,500 | 89% |
| 2017 | 29,853,708 | 49,367 | 0.17% | 45,858 | 93% | 48,192 | 44,675 | 93% | 40,117 | 83% | 37,475 | 93% | 8,075 | 17% | 7,200 | 89% |
| 2018 | 30,211,900 | 49,633 | 0.16% | 46,208 | 93% | 48,350 | 45,017 | 93% | 40,325 | 83% | 37,792 | 94% | 8,025 | 17% | 7,225 | 90% |
| 2019 | 30,535,650 | 50,500 | 0.17% | 46,883 | 93% | 49,175 | 45,517 | 93% | 40,908 | 83% | 38,242 | 93% | 8,267 | 17% | 7,275 | 88% |
| 2020 | 29,943,408 | 50,275 | 0.17% | 46,550 | 93% | 48,825 | 45,100 | 92% | 40,558 | 83% | 37,875 | 93% | 8,267 | 17% | 7,225 | 87% |
| 2021 | 30,366,367 | 49,183 | 0.16% | 45,592 | 93% | 47,625 | 44,042 | 92% | 39,542 | 83% | 37,025 | 94% | 8,083 | 17% | 7,017 | 87% |
| 2022 | 31,413,200 | 49,033 | 0.16% | 45,133 | 92% | 47,392 | 43,558 | 92% | 39,108 | 83% | 36,350 | 93% | 8,283 | 17% | 7,208 | 87% |
| 2023 | 31,931,675 | 50,092 | 0.16% | 45,783 | 91% | 48,350 | 44,092 | 91% | 39,692 | 82% | 36,642 | 92% | 8,658 | 18% | 7,450 | 86% |
| 2024 | 32,199,992 | 49,592 | 0.15% | 45,033 | 91% | 47,700 | 43,217 | 91% | 39,000 | 82% | 35,825 | 92% | 8,700 | 18% | 7,392 | 86% |
Source: UK payrolled employments by nationality, region, industry, age and sex, from July 2014 to December 2024
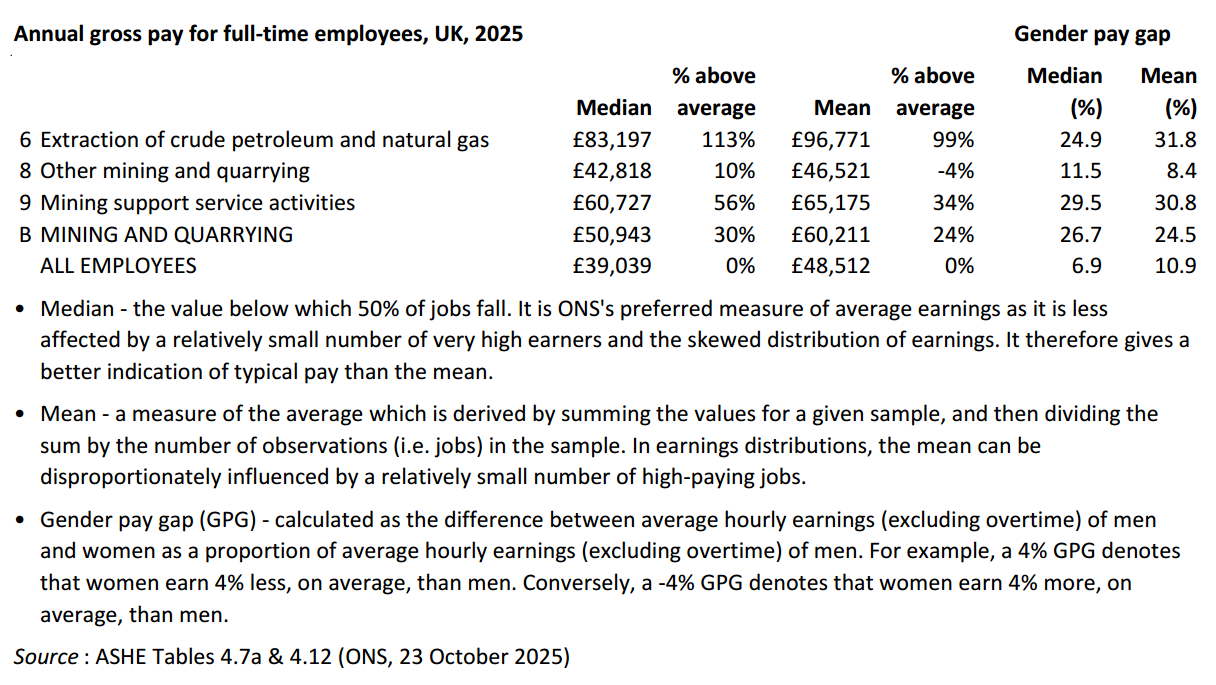
Employment in the UK extractives sector is, generally, well renumerated, as reflected in the following data on annual gross pay for full-time employees.
Regional location of extractive industries
Extractive industry employment levels have fallen markedly from their historic peak decades ago, mainly due to the decline of the coal industry, but extractive-related activities still contribute significantly to local employment in a number of regions.
The broad geographic spread of employment in the UK extractive sector (including oil and gas and mining support service activities) in 2022 is illustrated in Table 8. The concentration of employment in Scotland reflects the dominance of the Aberdeen area in terms of oil and gas-related activity. While the importance of the sector for the Scottish economy is well known, the relatively high shares of extractives activity in the East Midlands, the South West, the North East and Wales are also noteworthy.
Almost all extractives employment is full-time. In 2022, full-time employees engaged in oil & gas extraction and support activities represented 17% of all full-time employees in Aberdeen City and 4% in the surrounding area of Aberdeenshire. Other mining & quarrying was much less concentrated with a maximum share in any principal local authority area of only 3% of full-time employees in High Peak, North West Leicestershire and Rutland.
Table 9: Regional distribution of extractives employment in 2022 from Business Register and Employment Survey

The level of rounding applied varies by estimate. Please see this article for further information on how rounding is applied.
Source: ONS, Nomis (data extracted on 30 November 2023).
The data presented in Table 8 above are available on request from the UK EITI Secretariat.
Almost all UK oil and gas production comes from fields located offshore. The North Sea Transition Authority (NSTA) publishes maps showing the location of oil and gas fields in GB and on the UK Continental Shelf (UKCS) and on the UK Continental Shelf (UKCS). These maps also show which areas are under licence offshore and onshore in Great Britain. The Northern Ireland Department for the Economy (DfE) publishes a map showing which areas are under licence in Northern Ireland, but there is as yet no production there.
The NSTA also publishes data on individual wells and information on the well approval process and drilling activity.
The majority of coal production comes from sites in Scotland, England and South Wales, as mapped by the Coal Authority The mining and quarrying of non-hydrocarbon minerals are widely distributed across the UK. There are no significant hard-rock aggregate deposits in the South and East of England, so these materials are transported for use in these regions from further afield in the Midlands and South West in particular.
The Scottish Government provides views of onshore oil and gas fields, licences and wells via the Marine.gov.scot Open Data Network.
UK fossil fuel production and UK energy demand
UK production of fossil fuels has been, and continues to be, significant in terms of meeting UK energy demand. This is particularly true of oil and gas but, nowadays, much less so for coal.
While fossil fuels’ share of total demand has been declining, they still account for around three quarters of total primary energy demand and, based on current policies, latest DESNZ projections suggest they will still account for over 69% of total primary energy demand throughout the period to 2040.
Figures 2 and 3 show the evolution of UK energy demand and production since 1998. The recent decline in coal use and growth in renewables are shown clearly as is the impact of the COVID-19 pandemic on oil demand in 2020 and 2021.
Figure 2. UK Energy Demand
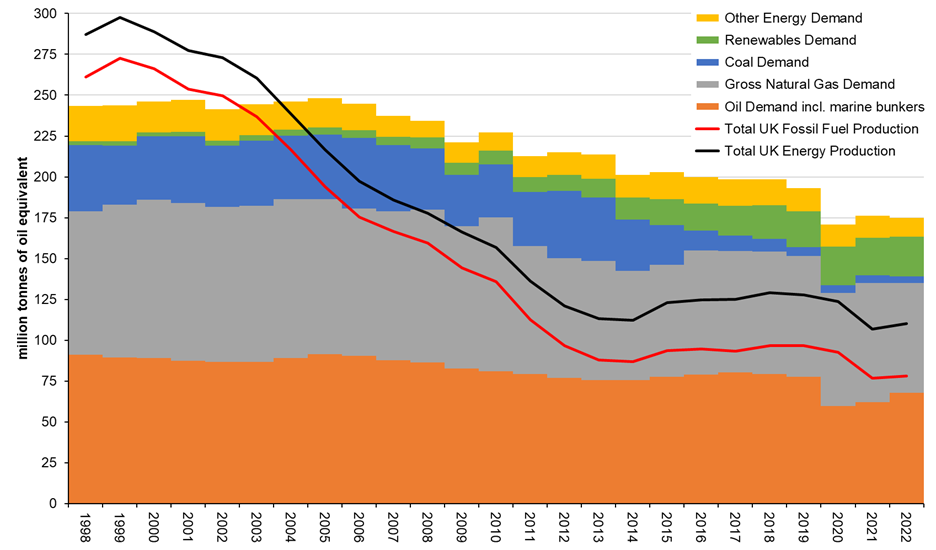
Sources: DUKES 2023 Tables 1.1 and 6.1 (DESNZ, July 2023)
The data presented in Figure 2 above are available on request from the UK EITI Secretariat.
Figure 3. UK Energy Production
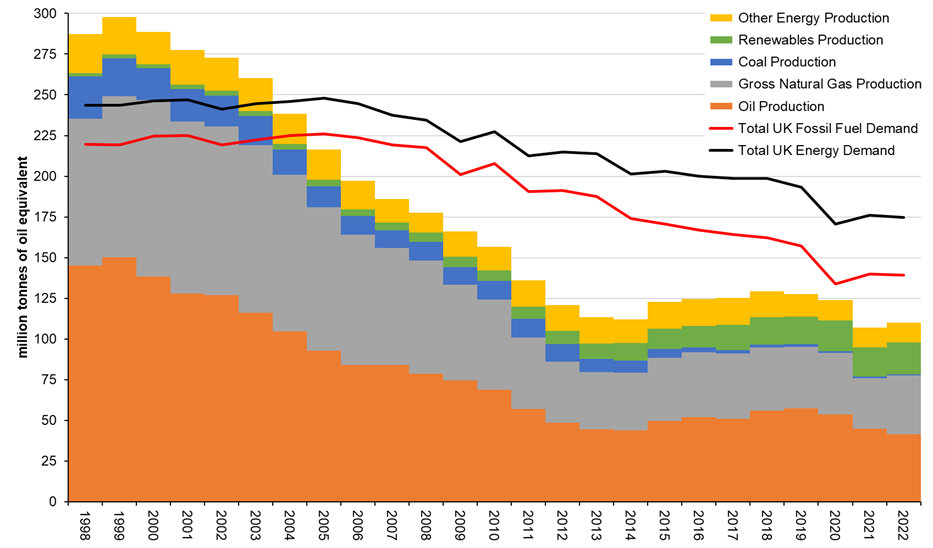
Sources: As Figure 2.
The data presented in Figure 3 above are available on request from the UK EITI Secretariat.
Please note that under the UK EITI Open Data policy users can re-use the data in the tables and figures.
- GVA is a measure of economic output – capturing the value of goods and services produced by a sector – and is often used to indicate a sector’s contribution to the economy. It is gross because it makes no allowance for depreciation of capital. It is approximately equal to gross operating surplus plus compensation for employees.
- Generally in this page, unlike in the ONS table and some other official sources, a terminological distinction is made between “oil and gas” and “[other] mining and quarrying”, the latter comprising the extraction of coal and of all non-hydrocarbon minerals. We have included mining support service activities in the total for the sector when calculating its contribution to GDP.
| Abbreviation | Explanation |
|---|---|
| BEIS | Department for Business, Energy & Industrial Strategy |
| billion | one thousand million or 109 |
| DfE | Department for the Economy |
| DUKES | Digest of United Kingdom Energy Statistics |
| EITI | Extractive Industries Transparency Initiative |
| GB | Great Britain |
| GDP | Gross Domestic Product |
| GVA | Gross Value Added |
| MSG | Multi-Stakeholder Group |
| NSTA | North Sea Transition Authority |
| OBR | Office for Budget |
| ONS | Office for National Statistics |
| SIC | Standard Industrial Classification |
| UK | United Kingdom |
| UKCS | UK Continental Shelf |
- GVA is a measure of economic output – capturing the value of goods and services produced by a sector – and is often used to indicate a sector’s contribution to the economy. It should be noted that the sectoral GVA data published here are very different from (and often much lower than) those previously published by the ONS. The revised estimates of GVA reflect methodological changes introduced for Blue Book 2019 (October 2019). Read more
- Generally in this page, unlike in the ONS table and some other official sources, a terminological distinction is made between “oil and gas” and “[other] mining and quarrying”, the latter comprising the extraction of coal and of all non-hydrocarbon minerals. We have included mining support service activities in the total for the sector when calculating its contribution to GDP. Read more